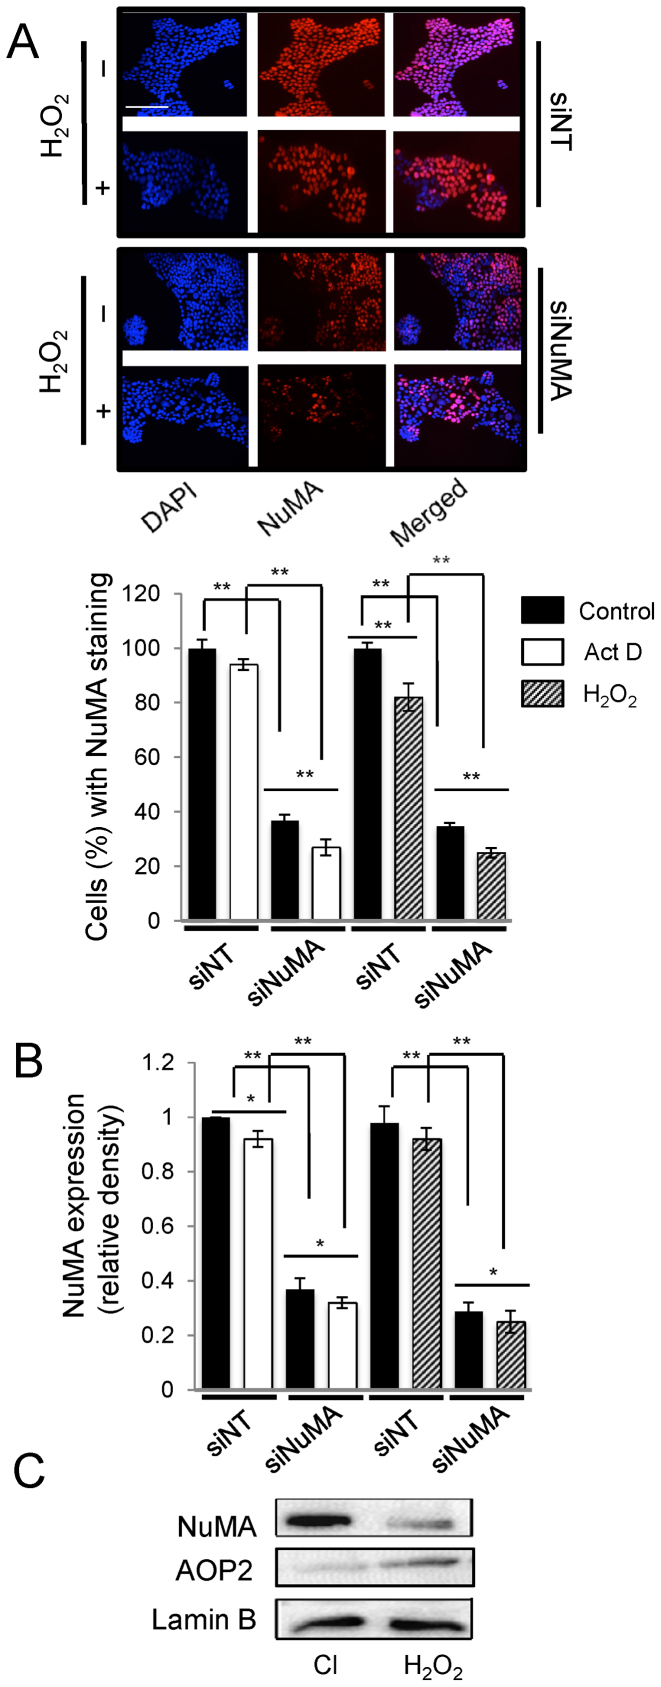
Figure 7.
Treatments with Actinomycin D and H2O2 decrease NuMA expression. S1 cells were treated with either siRNAs against NuMA (siNuMA) or non-targeting siRNA (siNT) and left in culture for 10 days before incubation with 250 μM of H2O2 or with 0.08 μg/ml actinomycin D (Act. D) for 4 h on day 10. (A). Immunostaining for NuMA (red); nuclei are stained with DAPI (blue) following H2O2 treatment. The bar graph shows the percentage of cells with NuMA staining under all treatment conditions (n = 3; 150 nuclei analyzed per condition). (B) Bar graph of NuMA quantification following western blots and standardization to loading control lamin B under all treatment conditions. (C) Representative western blots for NuMA, oxidative stress response marker AOP2 and loading control lamin B following treatment of S1 cells differentiated into acini in 3D culture with 250 μM of H2O2 for 4 h (Cl = vehicle control). *P < 0.05; **P < 0.01; multiple-factor ANOVA and Tukey's posthoc test; note: for B, individual comparison to the first siNT that is standardized on the graph was done with one sample t-test. Size bar, 100 μm.

