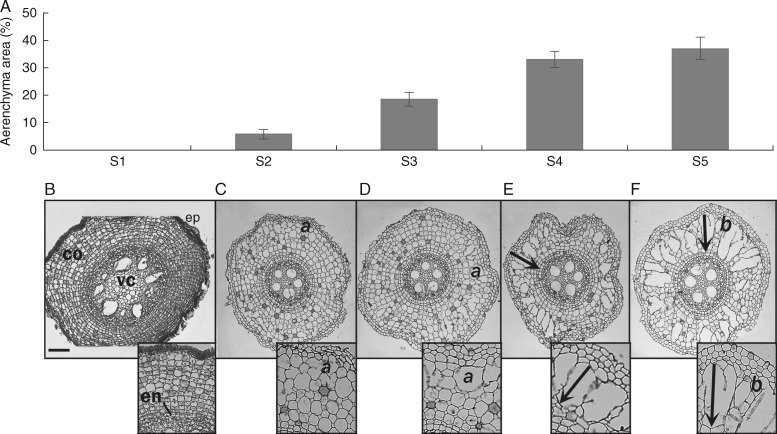
Fig. 1.
Aerenchyma formation in sugarcane root from apex to 5 cm divided into 1-cm segments (S1–S5). (A) Area of aerenchyma represented as the percentage of gas spaces in root cortex (n = 21); bars indicate standard error. (B–F) Cross-sections of historesin-embedded root segments. (B) Root apex (S1) shows intact tissues: peripheral tissues (ep), cortex (co), endodermis (en) and vascular cylinder (vc). (C, D) Initiation of aerenchyma formation with cell wall rupture in more peripheral cells of the cortex (a in panels C and D). (E, F) Development of aerenchyma towards vascular cylinder (arrows) and fully developed aerenchyma with living cell lanes separating gas spaces (A). Scale bar = 20 µm.

