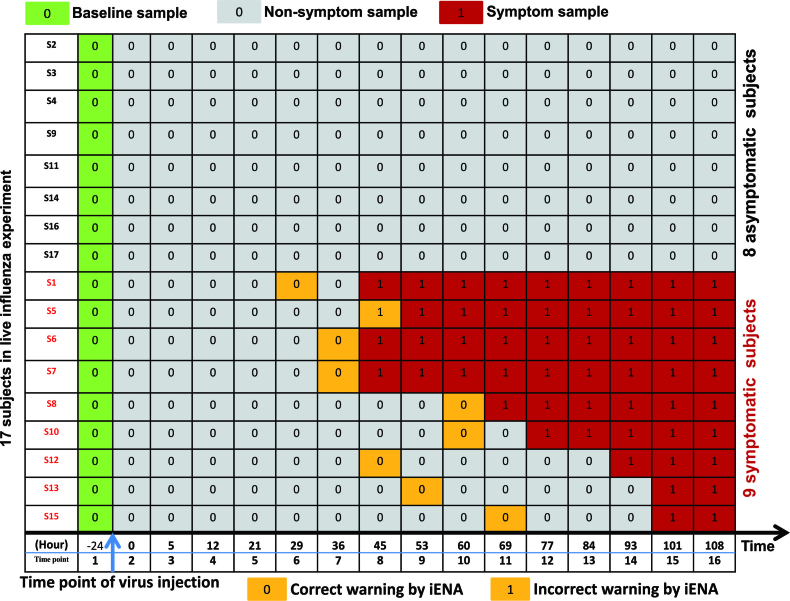
Figure 2.
The sample organization of dataset about influenza infection. The subjects are divided into two groups according to the clinical symptom chart based on the standardized symptom scoring: symptomatic (Sx) group with nine subjects (subjects S1,S5,S6,S7,S8,S10,S12,S13,S15) and asymptomatic (Asx) group with eight subjects (subjects S2,S3,S4,S9,S11,S14,S16,S17). The non-symptom samples (in grey) which have no significant clinical symptom, may have obvious changes in a network level; and we will identify edge-biomarkers for detecting early-warning signals before the time point of symptom samples (in red). The samples labeled in yellow colour indicates the time points predicted by our iENA based on dataset GSE52428, which is clearly earlier than the clinical symptom except one subject (S5). Actually, for the subject S5, the tipping point predicted by iENA coincides with the first symptom point at 45 h, but in this paper, we count it as an incorrect prediction.

