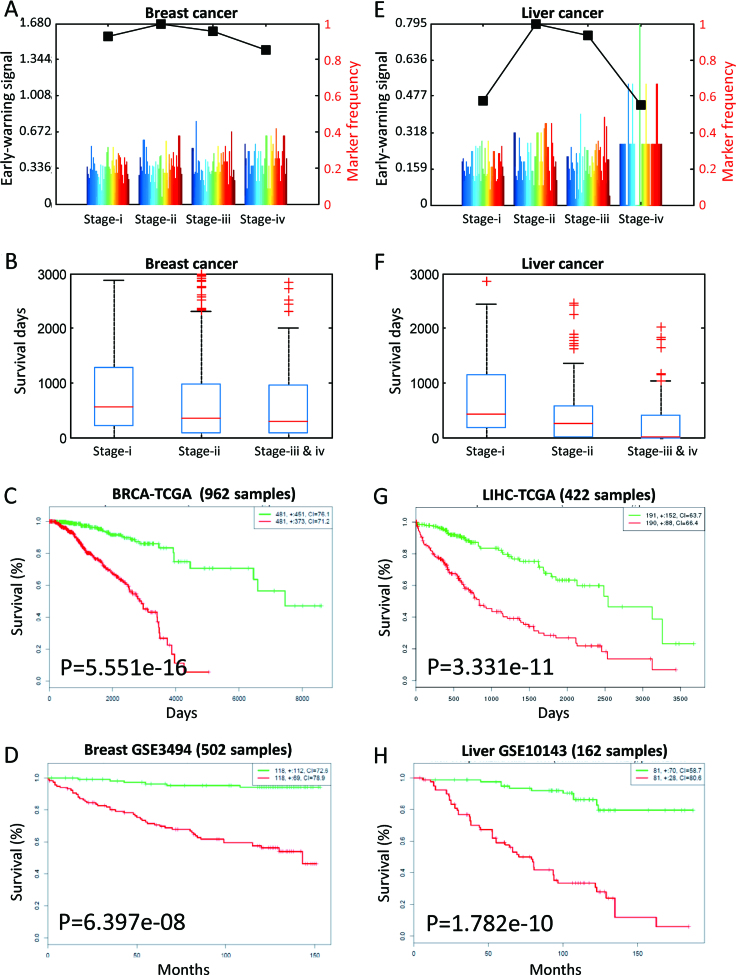
Figure 7.
The results on TCGA cancer data. (A) The iENA analysis on breast cancer (BRCA), where stage ii is identified as the tipping point. (B) The survival-day comparison for different breast cancer stages. (C) The survival analysis by coding-genes of edge-biomarkers on TCGA BRCA data. (D) The survival analysis by coding-genes of edge-biomarkers on GEO independent data. (E) The iENA analysis on liver cancer (LIHC), where stage ii is identified as the tipping point. (F) The survival-day comparison for different liver cancer stages. (G) The survival analysis by coding-genes of edge-biomarkers on TCGA LIHC data. (H) The survival analysis by coding-genes of edge-biomarkers on GEO independent data. Here, the edge-biomarkers are the DNB members.

