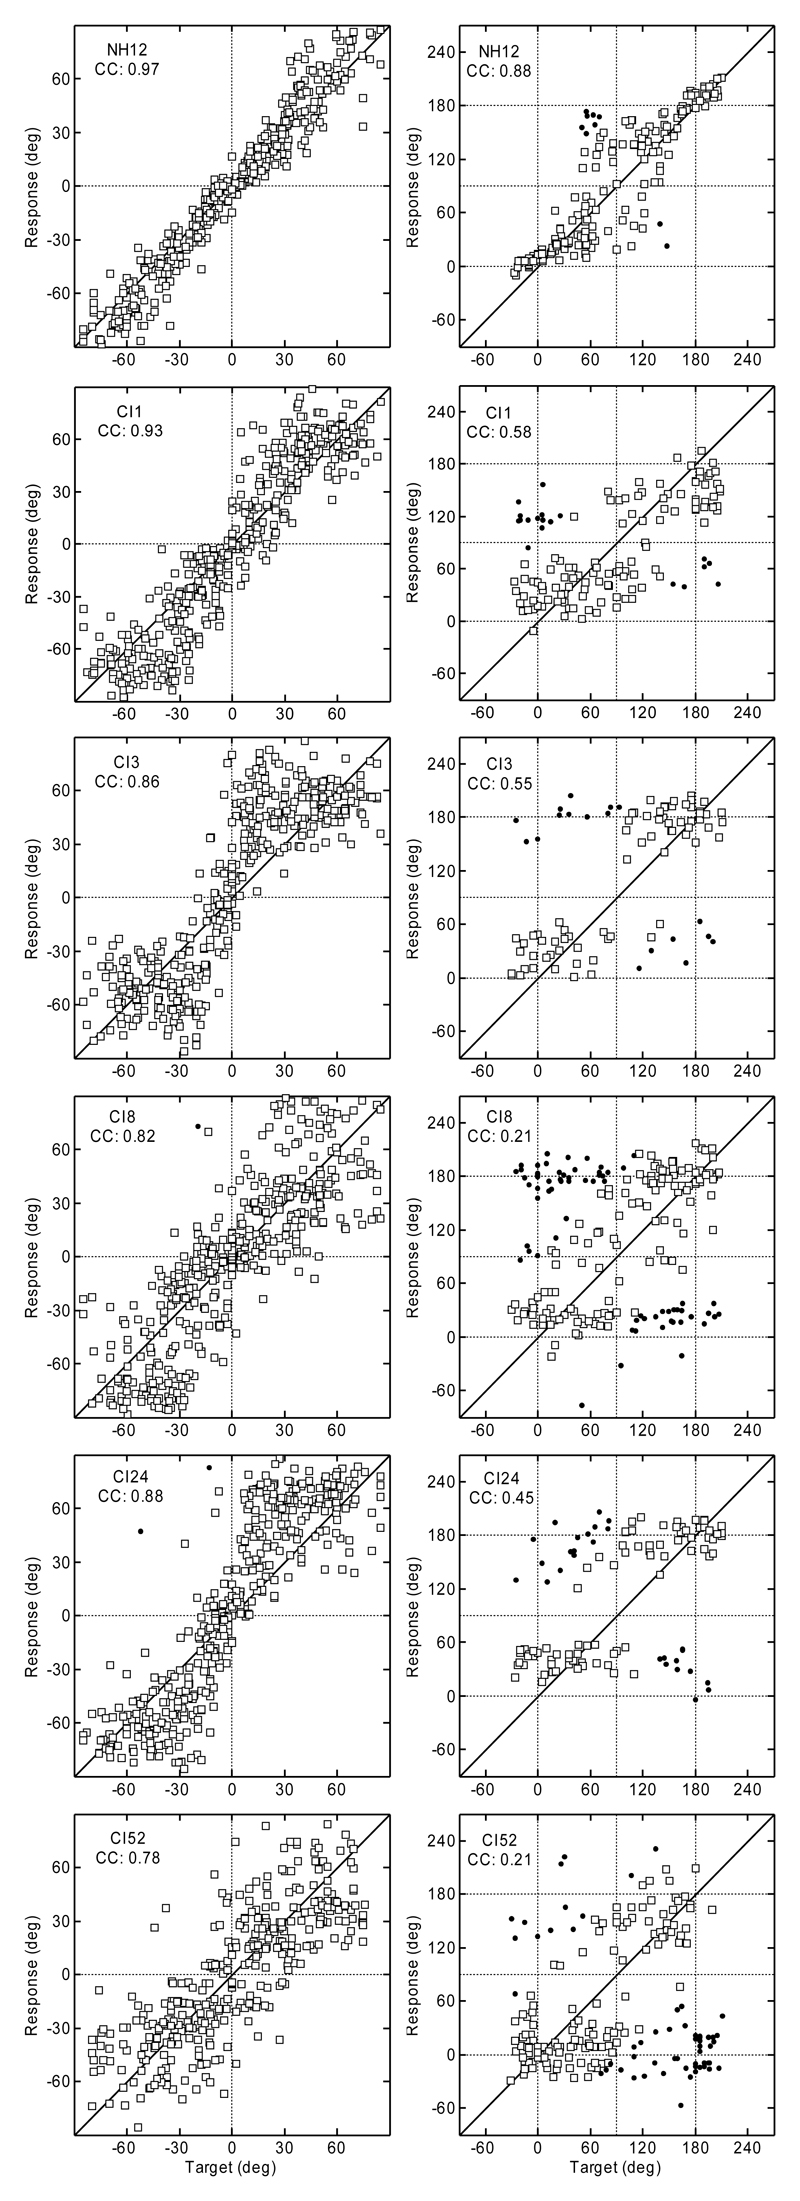
Fig. 1.
Top row: Localization results for a typical NH listener from the study by Majdak et al. (2010). Lower rows: Results for CI listeners from experiment 1. Lateral results are plotted in the left column and the polar results in the right. Polar results outside the lateral range of 30° are not shown. Filled circles: Responses with errors outside the 90° range. CC, correlation coefficient between responses and targets.

