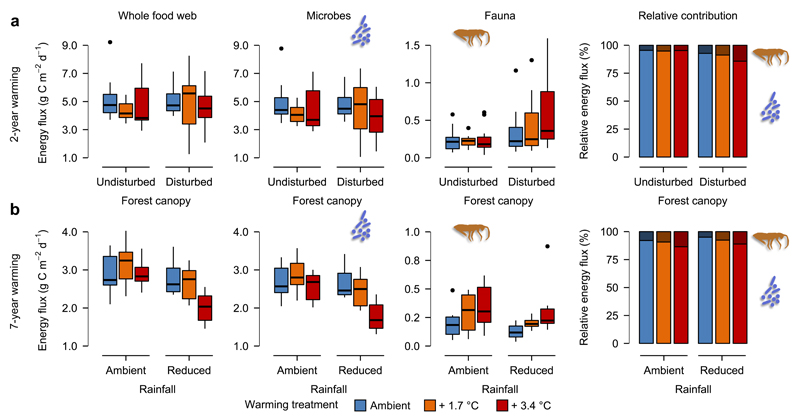
Figure 2. Warming effects on energy fluxes in the soil food web.
(a) Effects of warming in undisturbed and disturbed canopy habitats on overall energy flux in the whole food web, microbial-driven fluxes, faunal-driven fluxes, and on the relative contributions of microbes and fauna to whole food web energy fluxes (n=69). (b) Effects of warming under ambient and reduced rainfall on overall energy flux in the whole food web, microbial-driven fluxes, faunal-driven fluxes, and on the relative contributions of microbes and fauna to whole food web energy fluxes (n=35). Box plots are based on median (horizontal line), first and third quartile (rectangle), 1.5 × interquartile range (whiskers), and outliers (isolated points).

