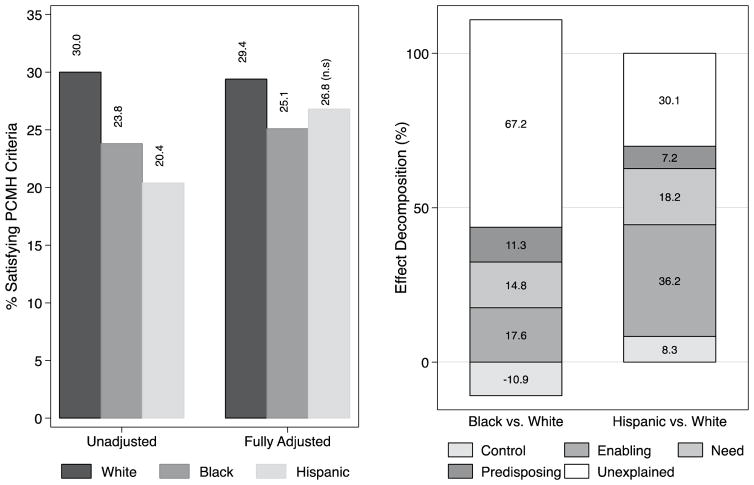
Fig. 1.
Unadjusted and adjusted prevalence of PCMH-like care experiences by race and ethnicity, and the determinants of minority group differences relative to Whites. Results are based on logistic regression models and Oaxaca-Blinder decomposition of data on United States adults 55-years and older reporting at least one visit to the doctor during the past 12-months from the 2008–2013 MEPS. Note 1: Prevalence estimates are based on logistic regression models (available from the authors upon request). Note 2: U = Unadjusted (crude), Fully adjusted = Adjusted for predisposing (sex, age, household income), enabling (insurance, education, language), health need (self-reported health status, mental SF-12, physical SF-12, number of chronic medical conditions), factors and controls (region, and survey year). Note 3: Effect decomposition are based on non-linear Oaxaca-Blinder techniques. Bars included in the negative quadrant of the graph represent factors that contribute to higher access among racial/ethnic minority groups. Bars included in the positive quadrant of the graph represent factors that would enhance access among racial/ethnic minorities. The width of each bar represents the percentage of between group difference (e.g. Black vs. White) in the probability of access to PCMH-like care explained by the factors or, more specifically, the expected change in difference if both groups had similar characteristics. The sum of the positive (including unexplained) and negative contributors add up to 100 % of the difference between the compared groups

