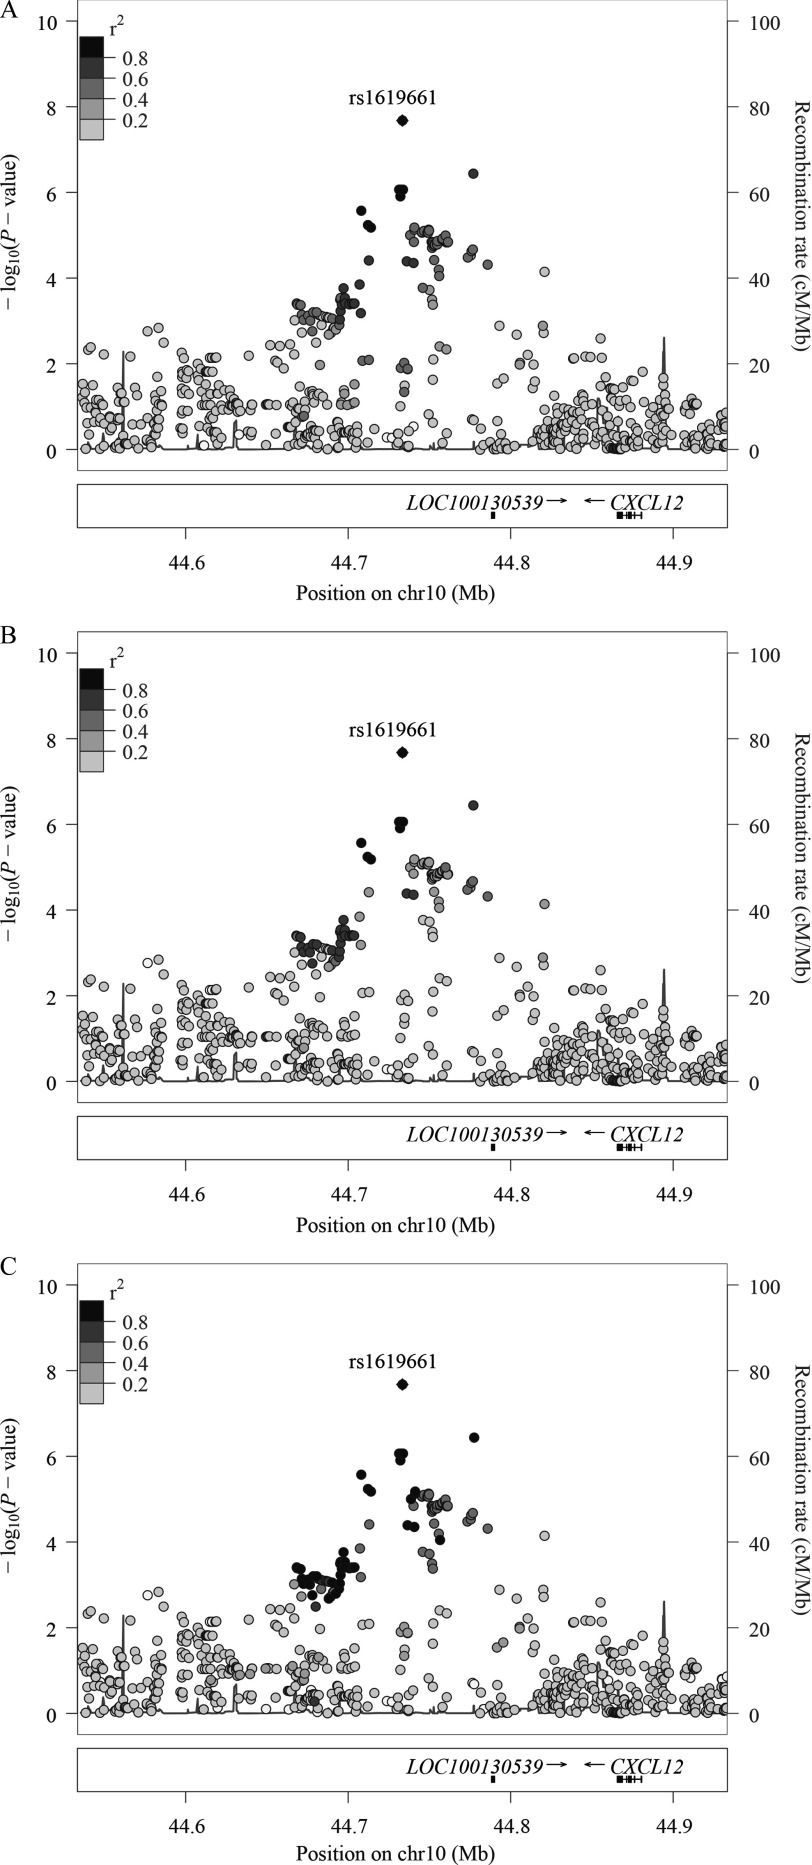
Figure 2.
Regional plots of the locus, rs1619661, identified by the trans-ethnic, fixed-effects meta-analysis of the interactions, on chromosome 10, near CXCL12. Each point represents the p-value of a SNP plotted as a function of its genomic position (build 37) and the genome-wide significance threshold (p-value). One SNP reached this threshold. The color coding of all other SNPs indicated linkage disequilibrium with this lead SNP, estimated among Africans (A), Ad-mixed Americans (B), and Europeans (C) from 1000G. Recombination rates were estimated from the 1,000 Genomes Project.

