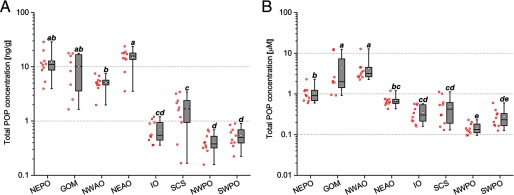
Figure 1.
Variation of POP levels in wild yellowfin tuna (Thunnus albacares) captured at different locations across the globe. (A) Levels of total POPs across eight capture locations on a mass basis. (B) Lipid-normalized total POP concentrations across the eight sites. Whiskers represent the minimum and maximum values. Diamonds represent the mean values. The horizontal line represents the 50th percentile, and the box represents the 25th and 75th percentiles. The red hollow spheres to the left of each box plot display the individual fish values. Letters in parenthesis represent subgroups of the sample population with means that were significantly different from each other upon and using Tukey’s post hoc analysis. Note: GOM, Gulf of Mexico; IO, Indian Ocean; NEAO, Northeast Atlantic Ocean; NEPO, Northeast Pacific Ocean; NWAO, Northwest Atlantic Ocean; NWPO, Northwest Pacific Ocean; SWPO, Southwest Pacific Ocean.

