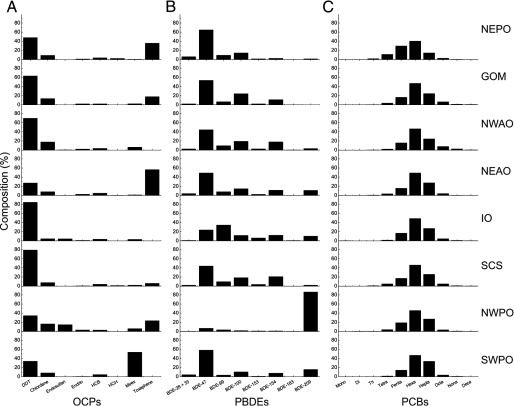
Figure 4.
Relative contributions of individual congeners to the total of each pollutant class. The percentage of each congener group relative to the total levels of OCPs (A), PBDEs (B), or PCBs (C). The POP compounds were grouped according to their occurrence in technical mixtures or common chemical structures. Due to co-elution of BDE-28 and BDE-33, the sum of both congeners is shown. The PCB congeners were grouped according to their amount of backbone chlorination. Note: DDT, dichloro-diphenyl-trichloroethane; HCB, hexachlorobenzene; HCH, hexachlorocyclohexane.

