Figure 5.
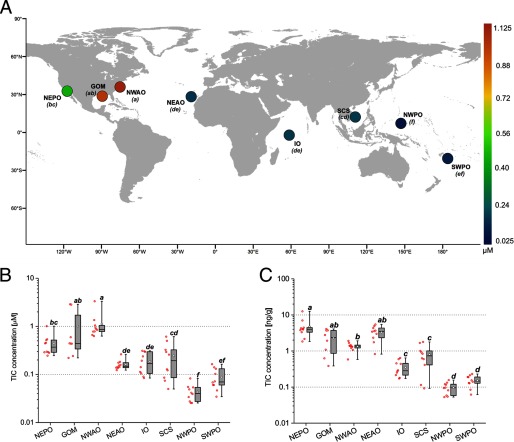
Levels of transporter interfering compounds (TICs) in yellowfin tuna. (A) Sampling locations for 78 wild yellowfin tuna, color-coded for the lipid-normalized average concentration () of the 10 previously identified transporter interfering chemicals (Nicklisch et al. 2016). Letters in parenthesis represent subgroups of the sample population with means that were significantly different from each other upon and using Tukey’s post hoc analysis. Box and whisker graphs represent the lipid-normalized (B) and mass-based (C) ranges of concentrations of the P-gp interfering chemicals across the eight capture locations. Note: GOM, Gulf of Mexico; IO, Indian Ocean; NEAO, Northeast Atlantic Ocean; NEPO, Northeast Pacific Ocean; NWAO, Northwest Atlantic Ocean; NWPO, Northwest Pacific Ocean; SWPO, Southwest Pacific Ocean.

