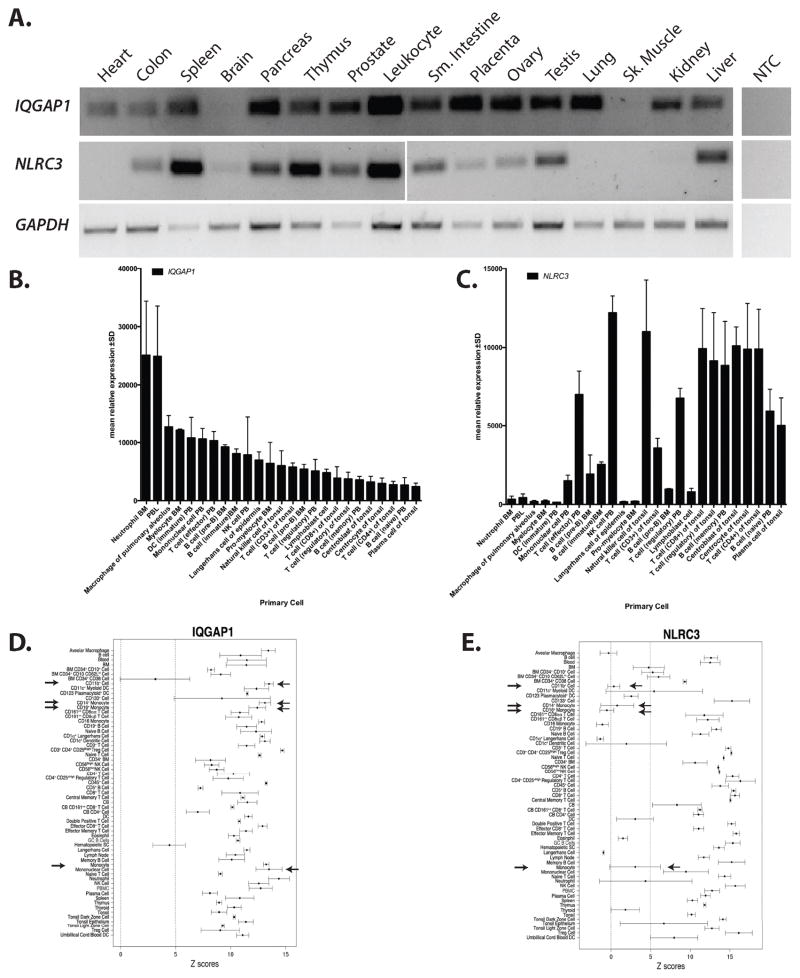
Figure 2.
IQGAP1 and NLRC3 are preferentially expressed in the immune system. RT-PCR was used to determine the tissue expression of human IQGAP1 and NLRC3. GAPDH was used as a positive control. BioGPS was queried for human IQGAP1 and NLRC3 expression in specific immune cells. The top overlapping cells and tissues for IQGAP1 and NLRC3 were graphed. B) Microarray results show relative IQGAP1 expression is highest in myeloid cells with moderate levels in lymphocytes. C) Relative NLRC3 expression is highest in lymphocytes with moderate expression in myeloid cells. Arrows have been used to illustrate the difference expression levels in primary monocytic cells. Abbreviations in panel A, B and C: NTC= no template control, BM=bone marrow, PBL=peripheral blood leukocyte, PB=peripheral blood, NK= natural killer cell. D and E) Across tissue expression for IQGAP1 (probe 200791_s_at) and NLRC3 (probe 236295_s_at), using immune cells and tissues, are shown. Z-scores ± median absolute deviation is plotted. A dashed line represents a z-score of 5 which signifies that a given transcript is expressed in a tissue. Arrows depict cells of monocyte/macrophage lineage. Abbreviations used in panel C and D: BM=bone marrow, DC=dendritic cell, Treg= regulatory T cell, CB=cord blood, DC=dendritic cell, GC=germinal center, NK=natural killer, PBMC=peripheral blood mononuclear cell. F) QPCR analysis of NLRC3 expression in human transformed cells lines. Values are normalized to HPRT levels using ΔCt method. Asterisk= p<.05 when compared to NTC

