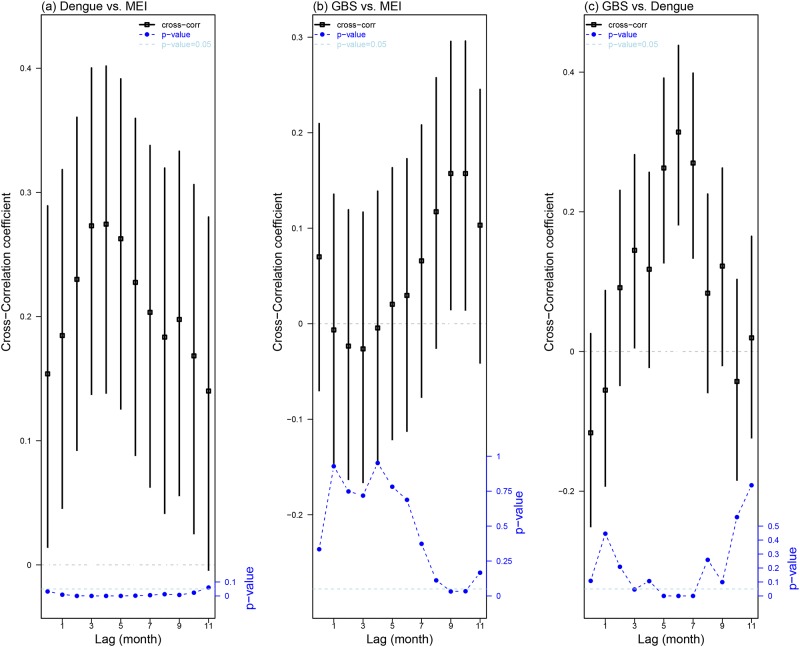
Fig 2. Cross-correlation coefficient results among dengue, MEI and GBS.
Panel (a) shows cross-correlation coefficients between dengue and MEI. Panel (b) shows cross-correlation coefficients between GBS and MEI. Panel (c) shows the cross-correlation coefficients between GBS and dengue. In all three panels, we consider time lags from 0 to 11 months. In this plot, the lag (namely l) of, for example, X vs. Y represents that Y lags l month(s) behind X (i.e., Xt+l is corresponding to Yt). The vertical black bars are 95% CI. The squares in the middle are the mean estimate of cross-correlation coefficients. The blue dotted line is p-value of each cross-correlation coefficient. The horizontal dashed light blue lines on all panels indicate the 0.05 significance level.

