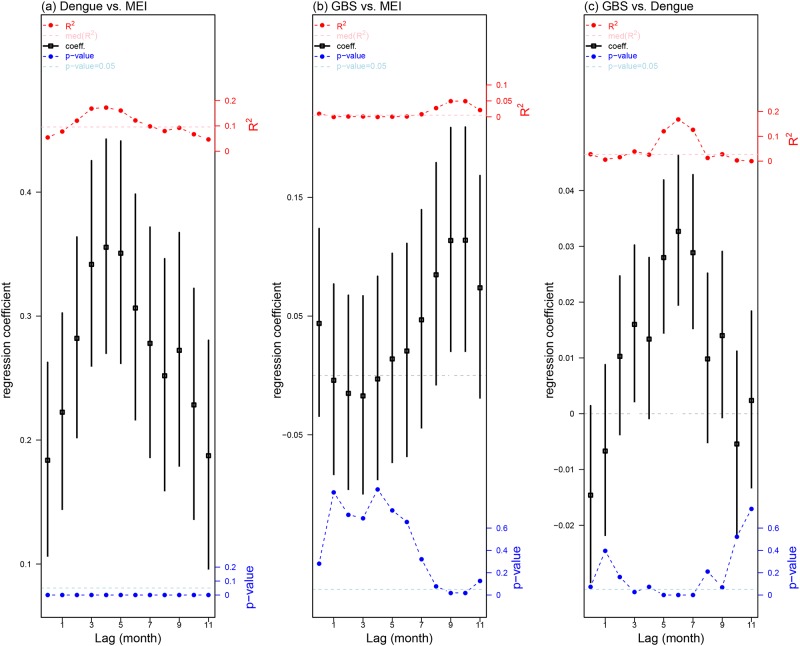
Fig 3. Poisson regression results among dengue, MEI and GBS.
Panel (a) shows regression coefficients between dengue and MEI, panel (b) shows regression coefficients between GBS and MEI and panel (c) shows regression coefficients between GBS and dengue. In all three panels, we consider time lags from 0 to 11 months. The vertical black bars are 95% confidence intervals and the squares in the middle are the mean estimate of regression coefficients. The blue dotted line is p-value of each correlation coefficient. The horizontal dashed light blue lines on all panels indicate the 0.05 significance level. The red dotted line is R2 of each regression coefficient. The horizontal dashed pink lines represent the median level of all R2.

