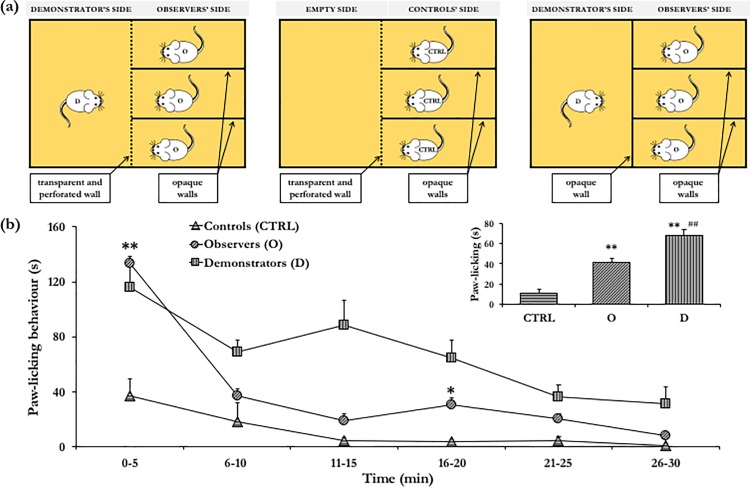
Fig 3. The emotional contagion test.
(a) Schematic representation of the experimental apparatus. (left) The Demonstrator mouse (D) is injected with 1% formalin concentration whilst the 3 Observers (O) mice with 0.2% formalin concentration. O mice are then tested in visual and olfactory contact with a D mouse. This setting was used in EXPERIMENTS 1, 2, 3. (middle) Control individuals (CTRL) are injected with 0.2% formalin concentration and tested in the absence of a D mouse. This setting was used in EXPERIMENT 1. (right) The D mouse is injected with 1% formalin concentration whilst the 3 O mice with 0.2% formalin concentration. O mice are then tested in the presence of a D mouse providing olfactory but not visual cues. This setting was used in EXPERIMENT 3. (b) Paw-licking behaviour in mice injected with different formalin concentrations in EXPERIMENT 1. Controls (CTRL) curve: male mice tested individually for paw-licking response to injection in a rear paw with 0.2% formalin concentration. Observers (O) curve: mice tested socially for paw-licking response to injection with 0.2% formalin concentration (i.e. in the presence of a Demonstrator mouse injected with 1% formalin concentration). Demonstrators (D) curve: mice tested socially for paw-licking response upon 1% formalin concentration. ** p < 0.01, O vs CTRL during interval 0–5; * p < 0.05, O vs CTRL during interval 16–20. (inset) Integral response of CTRL, O and D mice, obtained as the average of the values constituting Fig 3B. ** p < 0.01, significantly different from CTRL; ## p < 0.01 significantly different from O.

