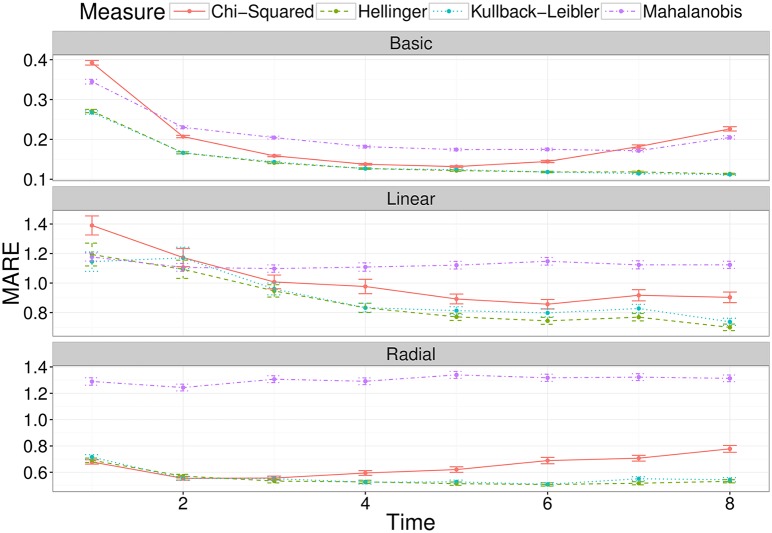
Fig 4. The average mean absolute relative error (MARE) across a number of observation times, for the two-compartment network (top panel), the linear four-compartment network (middle panel) and the radial four-compartment network (bottom panel).
Each point is the average for that measure, at that observation time, with error bars representing the standard error.

