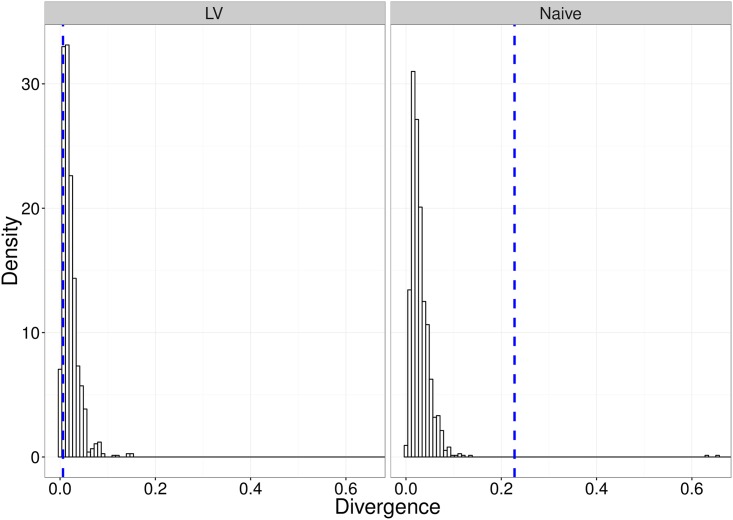
Fig 15. Figures demonstrating the goodness-of-fit of the two models to the respective data sets.
The histogram bars are the bootstrapped estimate of the null distribution of divergences under the model at the estimated parameter values for the respective model. The (blue) vertical dashed-line is the divergence corresponding to the observed data set.

