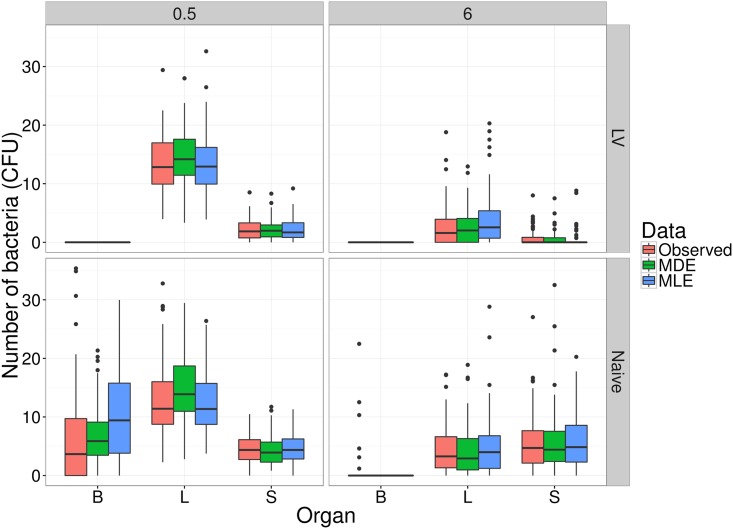
Fig 16. Observed experimental data for both naive and vaccinated groups, at both observation times, compared to simulations from the model at parameters estimated by both the MLE and MDE methods, in each of the blood (B), liver (L) and spleen (S).
Numbers of bacteria are the sums of eight identical WITS.

