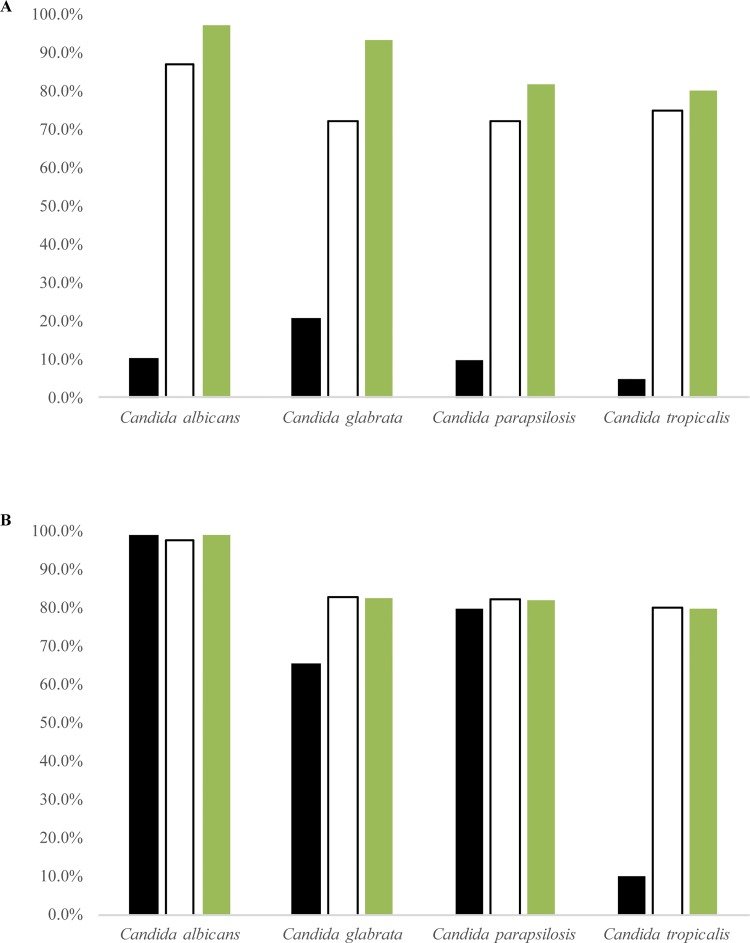
Fig 7. Comparison of single and double match approaches in classify Candida strains.
(A) Single match analysis with CHROMagar. (B) Double match analysis with CHROMagar and MALDI-TOF. Black columns represent the percentage of matchings’ to the Type Strain (TS); white columns report the matchings’ to the central strain (CS). Green columns report the percentage of the sum of matchings’ in the single match analysis (A) and the maximum obtainable percentage of correct matchings’ in the double match analysis (B).

