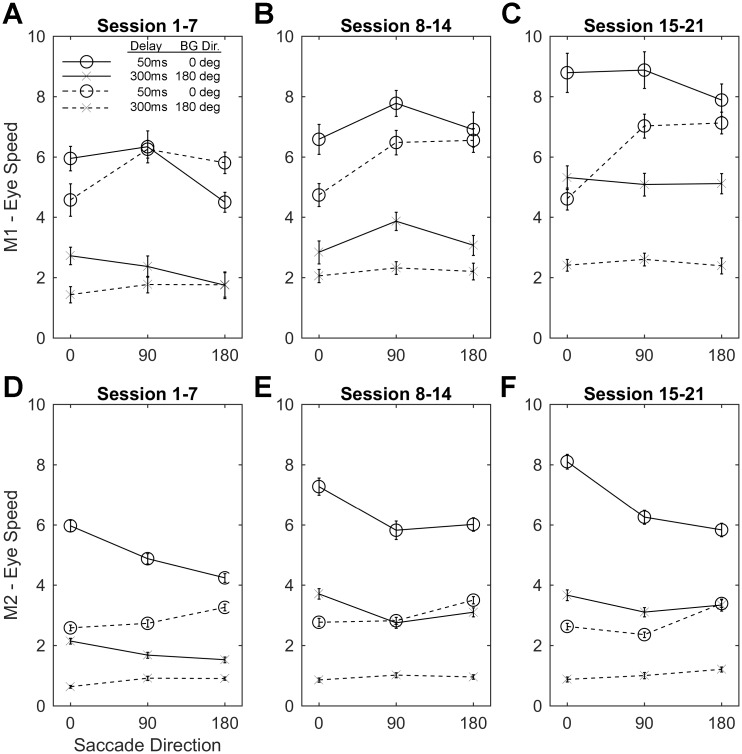
Fig 4. Analysis of ocular following speed following saccades at 0, 90 and 180 degrees.
Comparison of the ocular following speed for Monkey 1 (A-C) and Monkey 2 (D-F). Each plot: 1) shows the saccade direction across a stationary vertical grating (abscissa) plotted against the ocular following eye speed (ordinate); 2) Open circles show the responses at short delay (50ms) conditions, while the x’s show the responses at the long delay (300ms) conditions; 3) Solid and dashed lines indicate that the background motion driving the ocular following response was rightward (0deg) or leftward (180deg) respectively. Monkey 1 shows a tendency for ocular following responses to be reduced when the background motion during ocular following is in the opposite direction to the preceding saccade, compared to the same or vertical conditions. This effect is strongest and equal for short delay conditions (circles) in the first 7 sessions (A). Monkey 2 shows a tendency for ocular following responses to increase when background motion is in the same direction as the preceding saccade, compared to the opposite and vertical directions. This effect is strongest for the short delay conditions (circles 50ms) and is consistently strong across sessions (D-F).

