Figure 5.

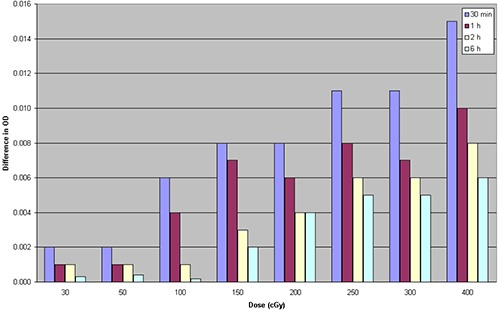
Variation of net optical density after 30 min, 1 h, 2 h, and 6 h compared to optical density 24 h after irradiation for eight different dose levels.

Variation of net optical density after 30 min, 1 h, 2 h, and 6 h compared to optical density 24 h after irradiation for eight different dose levels.