
Figure 7.
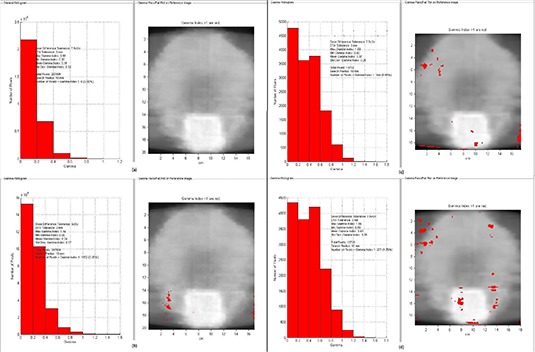
Γ analysis results of an example IMRT pelvis case obtained comparing the EBT3 dose maps scanned from both sides with the same calibration curve each other using (a) and (b) as DD and DTA criteria, and with the calculated dose maps (c) and (d) with criteria.