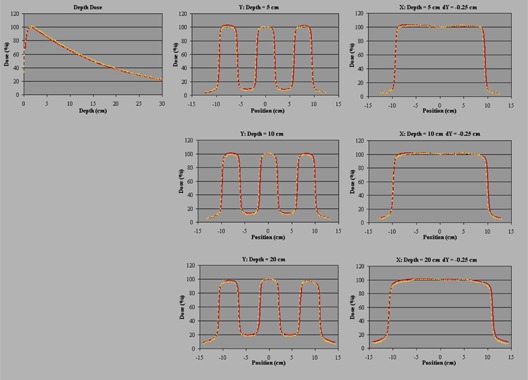
Figure 3.

Comparisons of the Agility beam model (yellow dotted lines) with the corresponding measured data (solid red lines) for the S‐shape field. The central axis percentage depth dose and two orthogonal central axis profiles at 5 cm, 10 cm, and 20 cm deep are shown. The profiles in the direction of the multileaf collimator leaf motion are offset by 0.25 cm from the central axis so as to measure dose under a leaf rather than between leaves. Depth dose is normalized to 1.6 cm deep and profiles are normalized to the central axis. X and Y refer to IEC 61217, and positive X is directed towards X1 and positive Y is directed towards Y2. Distances are in cm.
