Figure 6.

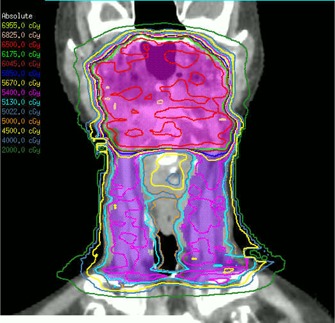
Representative coronal dose distribution for one of the Agility plans, showing the primary PTV (pink) and nodal PTV (purple).

Representative coronal dose distribution for one of the Agility plans, showing the primary PTV (pink) and nodal PTV (purple).