
Figure 7.
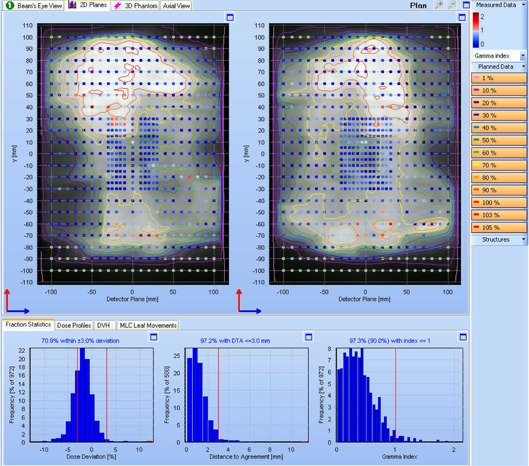
results for an Agility delivery with CVDR. The upper panels show the two planes of diodes in the phantom. The grayscale distribution and isodoses show the planned dose, normalized to the primary PTV dose. The colored squares show the gamma value (3% and 3 mm) for the measured dose. The lower graphs are histograms of dose difference, distance to agreement, and gamma for the measured dose with respect to the planned dose. In this case, 97.3% of measurements have a gamma value of less than unity, the pass criterion of 90% being shown in brackets above the gamma histogram.