
Figure 3.
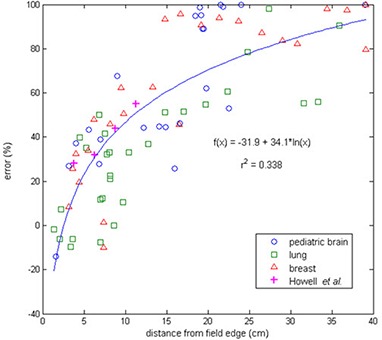
The error (%) between TPS‐calculated dose and TLD‐measured dose plotted as a function of distance from the field edge (the 50% isodose line) for the pediatric brain, lung, and breast IMRT treatment plans. Data from the study by Howell et al.( 10 ) with a simple mantle field and the Eclipse TPS is included for comparison.