
Figure 3.
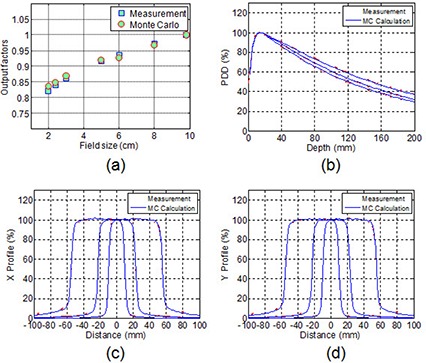
Comparison of output factors (a), and percentage depth dose (b), and beam profiles (c) and (d) for square fields of , and between the MC calculations and measurements in water phantom.
Official websites use .gov
A
.gov website belongs to an official
government organization in the United States.
Secure .gov websites use HTTPS
A lock (
) or https:// means you've safely
connected to the .gov website. Share sensitive
information only on official, secure websites.
Comparison of output factors (a), and percentage depth dose (b), and beam profiles (c) and (d) for square fields of , and between the MC calculations and measurements in water phantom.