Figure 6.

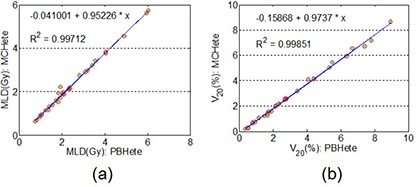
Correlations for the MLD (a) and the (b) of lungs for plans calculated with the MC and the PB with heterogeneity correction.

Correlations for the MLD (a) and the (b) of lungs for plans calculated with the MC and the PB with heterogeneity correction.