Figure 8.

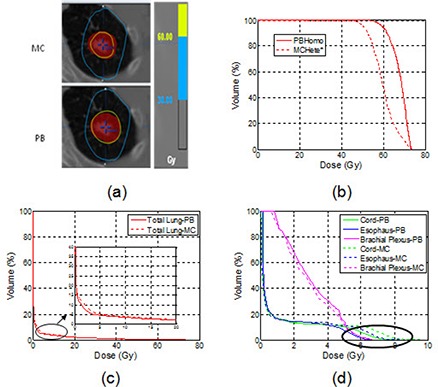
An example of the axial isodose distributions (a), DVHs of the PTV (b), DVHs of the lungs(c), and other OARs (d) for the MC calculations with heterogeneity correction and the PB without heterogeneity correction.

An example of the axial isodose distributions (a), DVHs of the PTV (b), DVHs of the lungs(c), and other OARs (d) for the MC calculations with heterogeneity correction and the PB without heterogeneity correction.