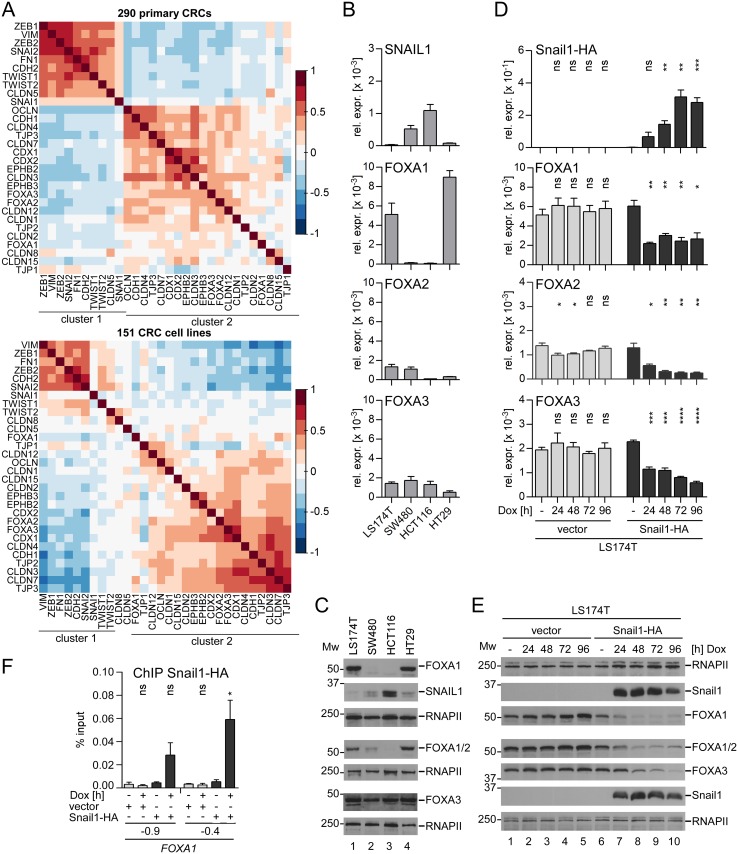
Fig 1. SNAIL1 is anticorrelated and interferes with FOXA expression.
(A) Pairwise correlation analyses of mRNA expression data from 290 primary CRCs (GSE14333) (upper panel) and from 151 CRC cell lines (GSE59857) (lower panel). Correlation coefficients are indicated by the different colors and the color scale shown. (B) qRT-PCR analyses to assess SNAIL1, FOXA1, FOXA2, and FOXA3 relative expression (rel. expr.) levels in a panel of CRC cell lines. Data are shown as mean and standard error of the mean (SEM); n = 3. (C) Western Blot to analyze SNAIL1, FOXA1, FOXA1/2 and FOXA3 protein expression in a panel of CRC cell lines. FOXA2 is detected simultaneously with FOXA1 due to crossreactivity of the antibody used (S2 Fig). MW = molecular weight in kDa. RNA polymerase II (RNAPII) immunodetection served as loading control. For every membrane used for protein detection an individual loading control is shown. (D) qRT-PCR analyses to assess Snail1, FOXA1, FOXA2, and FOXA3 relative expression (rel. expr.) levels in LS174T cells stably transduced with Dox-inducible retroviral control or Snail1-HA expression vectors. Shown is the mean and SEM; n = 3. (E) Western Blot to analyze Snail1-HA, FOXA1, FOXA1/2, and FOXA3 protein levels upon Dox-induced Snail1-HA expression in LS174T cells. MW = molecular weight in kDa. To monitor equal protein loading RNA polymerase II (RNAPII) was detected. (F) ChIP analysis to test for Snail1-HA occupancy at the FOXA1 promoter in LS174T cells. Data were calculated as percent input. Shown are the mean and SEM; n = 3.

