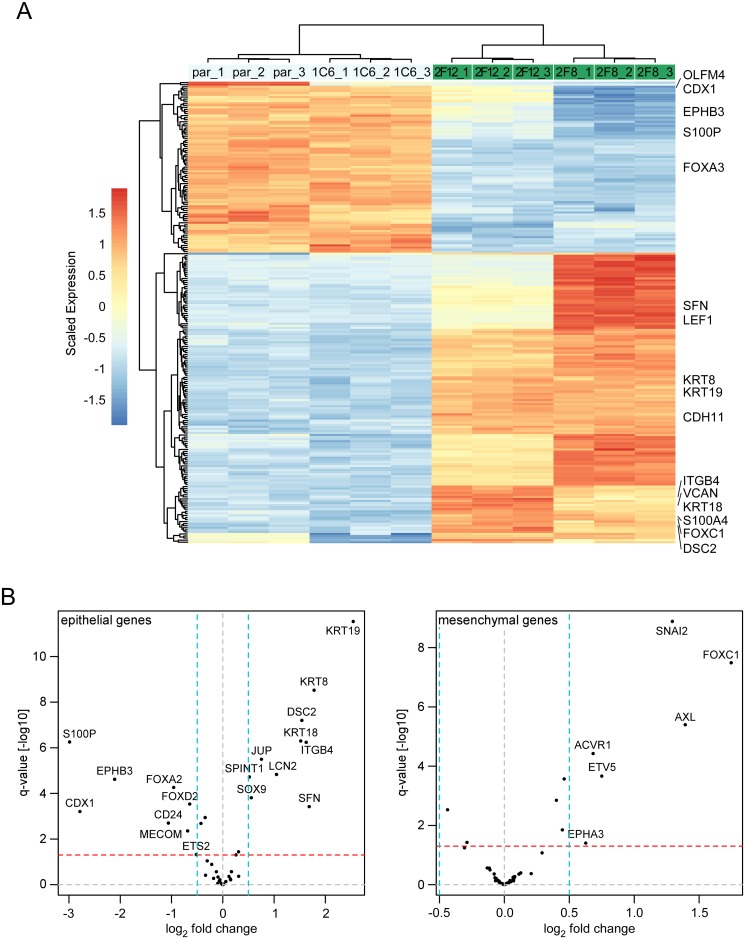
Fig 3. LS174T cell clones with absent/low FOXA expression show massive changes in gene expression and deregulation of a CRC EMT signature.
(A) Hierarchical clustering of gene expression profiles for parental (par) LS174T cells and LS174T cell clones subjected to CRISPR/Cas9-mediated genome editing of the FOXA1 locus. Expression values were scaled gene-wise to have zero mean and unit variance across all samples. Rows and columns were hierarchically clustered using complete linkage. Scaled expression differences are indicated by color shading according to the color scale shown. 1C6: FOXA1WT; 2F12: FOXA1KOA2A3lo; 2F8: FOXA1KOA2A3neg. Cutoffs: p-value < 0.05 and log2 fold-change > 1.5. Three independent RNA isolates were examined for each cell type. Selected examples for epithelial and mesenchymal marker genes are highlighted. (B) Volcano plots to visualize changes in the expression of epithelial (left panel) and mesenchymal components (right panel) of an EMT gene signature for colon cancer [35]. The epithelial gene set of this signature is significantly deregulated (p = 0.0005, undirected gene set enrichment test), while the mesenchymal gene set is significantly upregulated (p = 0.05, directed gene set enrichment test). Dashed horizontal and vertical lines indicate thresholds for q-values and log2 fold change.

