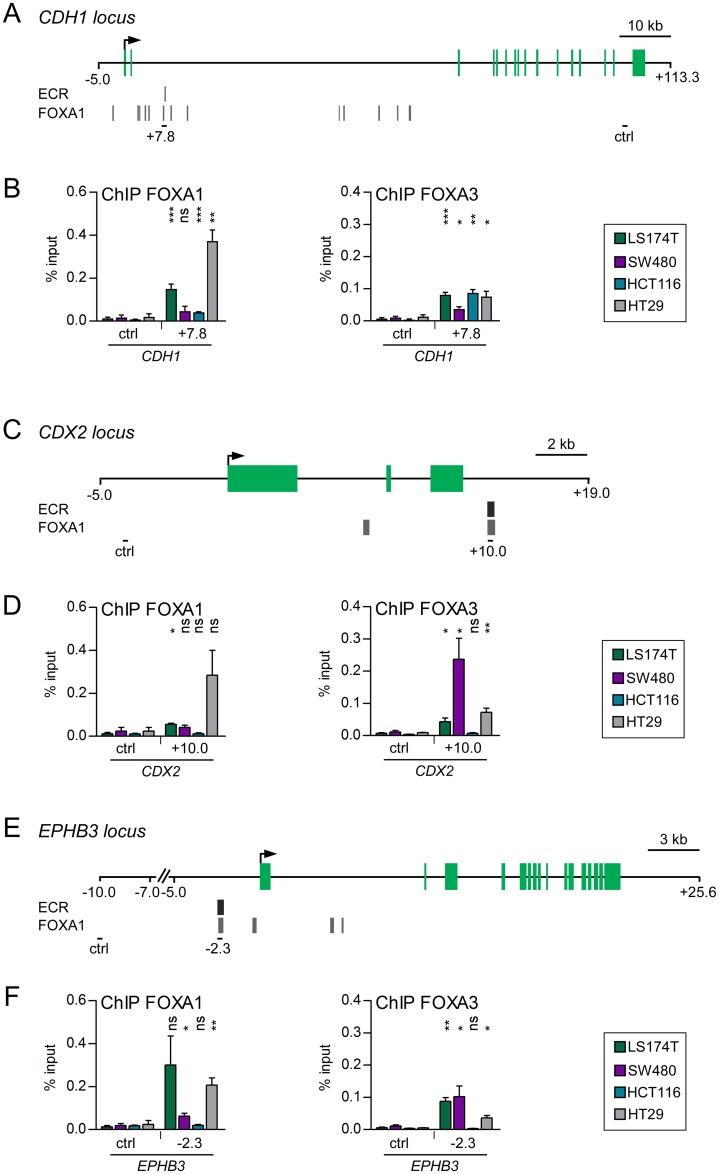
Fig 5. FOXA1 and FOXA3 are regulators of the CDH1, CDX2 and EPHB3 enhancers.
(A, C, E) Schemes of the CDH1 (A), the CDX2 (C), and the EPHB3 (E) gene loci. Gene annotation is based on the Ensembl genome browser. Exons are depicted in green. Transcriptional start sites are indicated by arrows. The positions of ECRs with predicted FOX binding motifs and signals from FOXA1 ChIP-seq analyses from the ENCODE project are shown below the schemes of the gene loci. The PCR-amplified regions analyzed in ChIP experiments are indicated by black bars. (B, D, F) ChIP analyses to test for binding of FOXA1 and FOXA3 at the CDH1 (B), the CDX2 (D) and the EPHB3 (F) loci in the indicated CRC cell lines. Data were calculated as percent input. Shown are the mean and SEM; n≥3. Statistical significance was calculated relative to the control regions at the respective gene loci.

