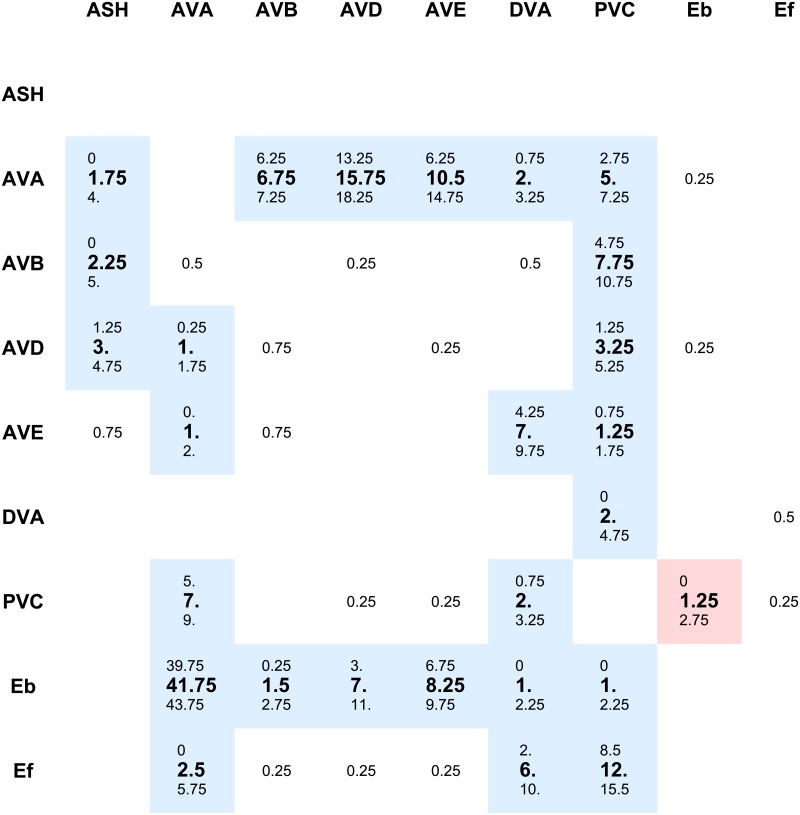
Fig 2. Synaptic connectivity matrix with polarity signs in the pre-motor network.
Synaptic strengths between neurons are shown as appropriate matrix elements (columns: presynaptic neurons; rows: postsynaptic neurons). The centered values correspond to mean number of synaptic contacts between neurons, upper values to means decreased by standard deviations, and lower values correspond to means increased by standard deviations. We highlighted in color those synapses whose signs were established by the optimization (the weakest synapses below 0.75 were not optimized). Blue color denotes inhibitory synapses, and red corresponds to excitatory. Note that all optimized connections are inhibitory. The only excitatory connection (Eb ↦ PVC) is fixed and set by hand, since A and B motor neurons are known to be excitatory [21, 57].

