Figure 4.

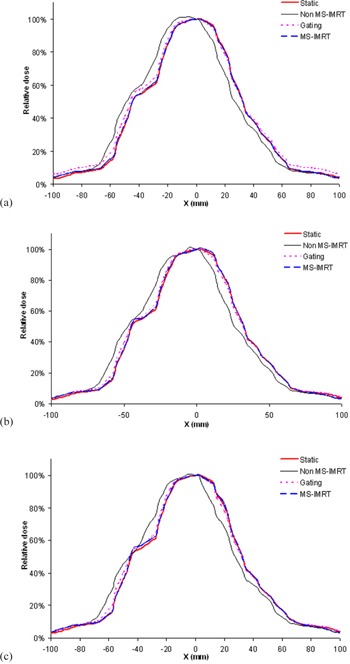
Dose profiles of various techniques are shown for dose rates 100 MU/min (a), 400 MU/min (b), and 600 MU/min (c). These profiles were obtained along the DMLC leaf motion direction at the central axis of Fig. 3.

Dose profiles of various techniques are shown for dose rates 100 MU/min (a), 400 MU/min (b), and 600 MU/min (c). These profiles were obtained along the DMLC leaf motion direction at the central axis of Fig. 3.