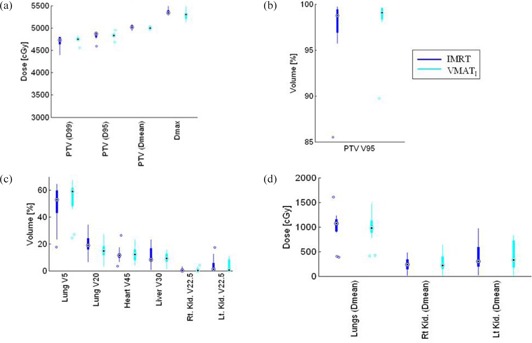
Figure 1.

Box‐and‐whisker plot of DVH metrics representation showing the median, max, min, and outliers of IMRT and : (a) PTV (D99, D95, D mean, and ) dose comparison between IMRT and plans; (b) PTV coverage for IMRT and plans; (c) organ at risk volume of lungs, heart, liver, kidneys, and spinal canal 3 mm prv comparison; (d) organ at risk mean doses (lungs, right and left kidney).
