Figure 2.

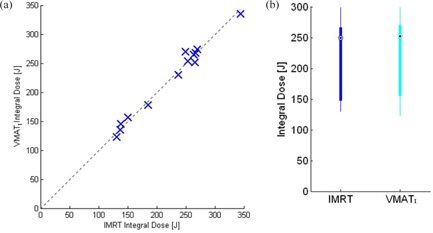
Integral‐dose comparison [J] of and IMRT plans: (a) linear plot representing a typical patient dose score; (b) box plot represent the minimal and maximum ranges of integral dose.

Integral‐dose comparison [J] of and IMRT plans: (a) linear plot representing a typical patient dose score; (b) box plot represent the minimal and maximum ranges of integral dose.