
Figure 4.
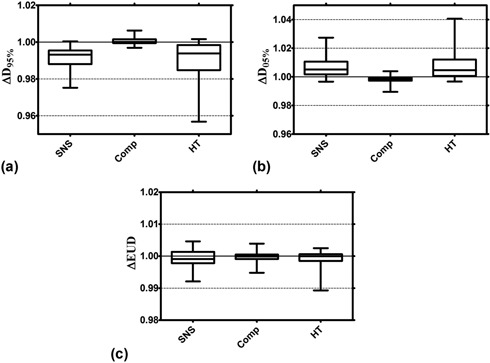
An intermodality comparison of the dosimetric effect of motion when the CTV does not move outside the margin (‘Max Motion ‐ Margin’ ). The data are displayed as the median value (central horizontal line), 25th and 75th percentiles (box), and the largest/smallest values (error bars) for changes in (a), (b), and EUD (c).