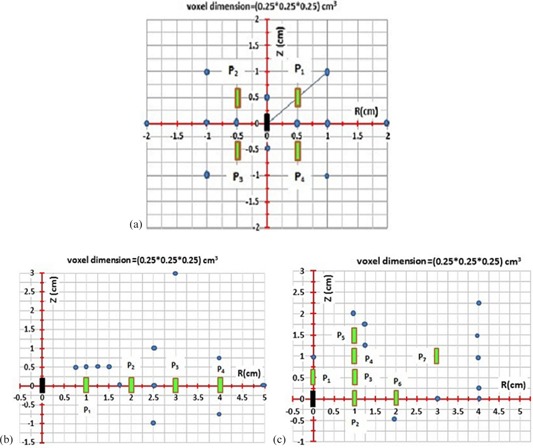
Figure 2.

Three different simple configurations were considered to check the ISA and perturbation model accuracies ((7), (8)): (a) for case #1, the active source is in center and four other inactive seeds are at four different plans; (b) for case #2, the active source is in center and four inactive seeds are parallel to the longitudinal source axis; (c) for case #3, the active source is in center and more inactive seeds are placed along the same longitudinal axis. For all cases, the P‐values for any inactive seed position are determined with where the subscript “i” is the position number of the inactive source. The solid circles are the interest calculation points coordinates of P‐values, which are noted in 1, 2, 3, respectively.
