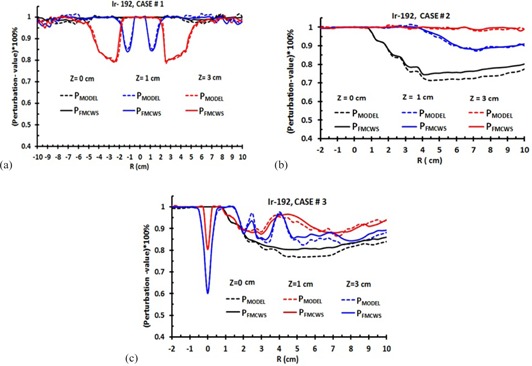
Figure 7.

ISA‐ and P‐values percent model ((7), (8)) in comparison to FMCWS for all three cases. These typical data are shown for and 3 cm. Figs. (a), (b), and (c) show data for case #1, #2, and #3, respectively. or represented FMCWS. or means or and represent . The solid and dash lines are represent the and values, respectively. The maximum differences between FMCWS and MODEL are at , for case #2 (3.5%). The MC statistic uncertainties are at most 1.5%.
