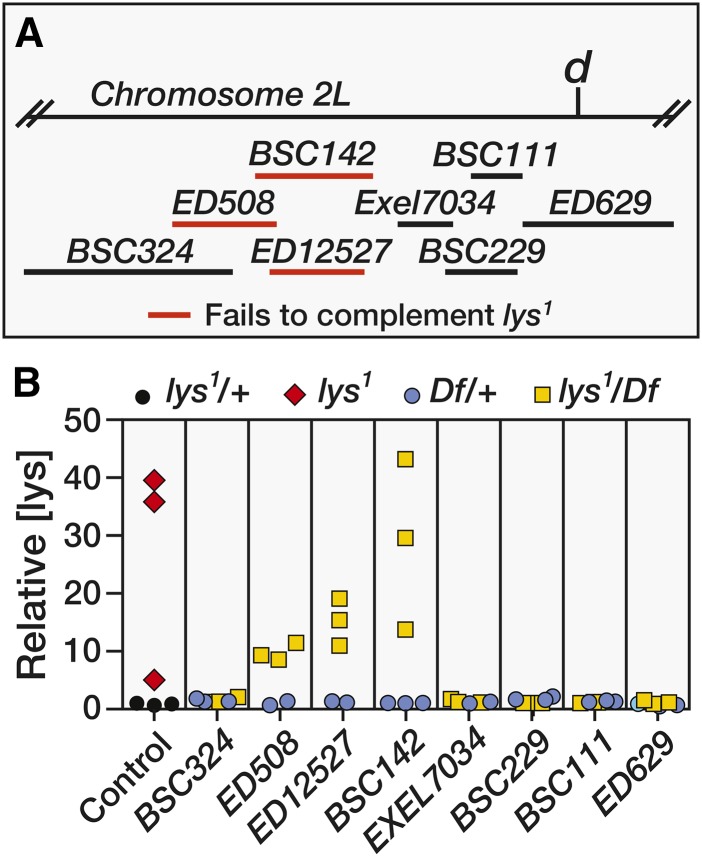
Figure 2.
Deficiency mapping of lys1. (A) A schematic diagram illustrating the size and position of the molecularly-defined deficiencies used to genetically map lys1. Homozygous lys1 females were crossed with deficiencies (Df) that span the genomic region to the left of dachs (d). Deficiencies highlighted in red failed to complement lys1. (B) GC-MS was used to measure relative lysine levels in 3-day-old adult males. Animals that were heterozygous for either lys1 or any of the examined deficiencies exhibited similar lysine levels. In contrast, homozygous lys1 mutants and males that were trans-heterozygous for lys1 and either Df(2L)ED508, Df(2L)ED12527, or Df(2L)BSC142 displayed lysine levels that were up to 50-fold higher than controls. Each data point represents a single sample that contained 25 adult male flies. GC-MS, gas chromatography-mass spectrometry.

