Figure 1.
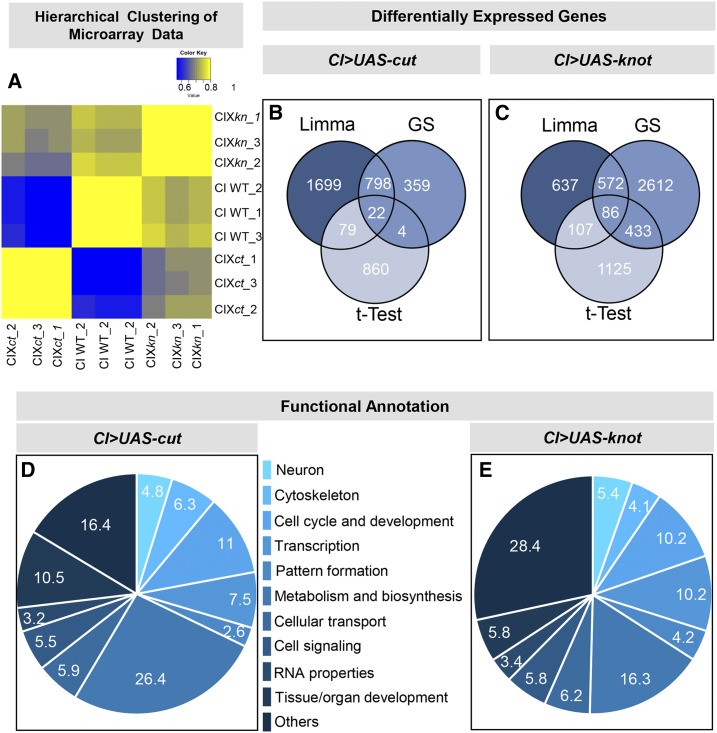
Neurogenomic analyses of Ct- and Kn-mediated transcriptional programs. (A) Heatmap (Pearson’s correlation) of the triplicate microarray data (CI WT, CI X kn, and CI X ct) reveals all arrays segregate into three well-defined and distinct clusters with high interarray correlation between replicates. Ectopic expression profiles for Ct or Kn are anticorrelated to controls and show a higher degree of correlation relative to each other. (B and C) Venn diagram of the three statistical tests [Limma, GeneSpring (GS), and t-Test] used for the differential expression analyses of the microarray data. (D and E) Functional annotation analyses of Ct and Kn differentially expressed genes.

