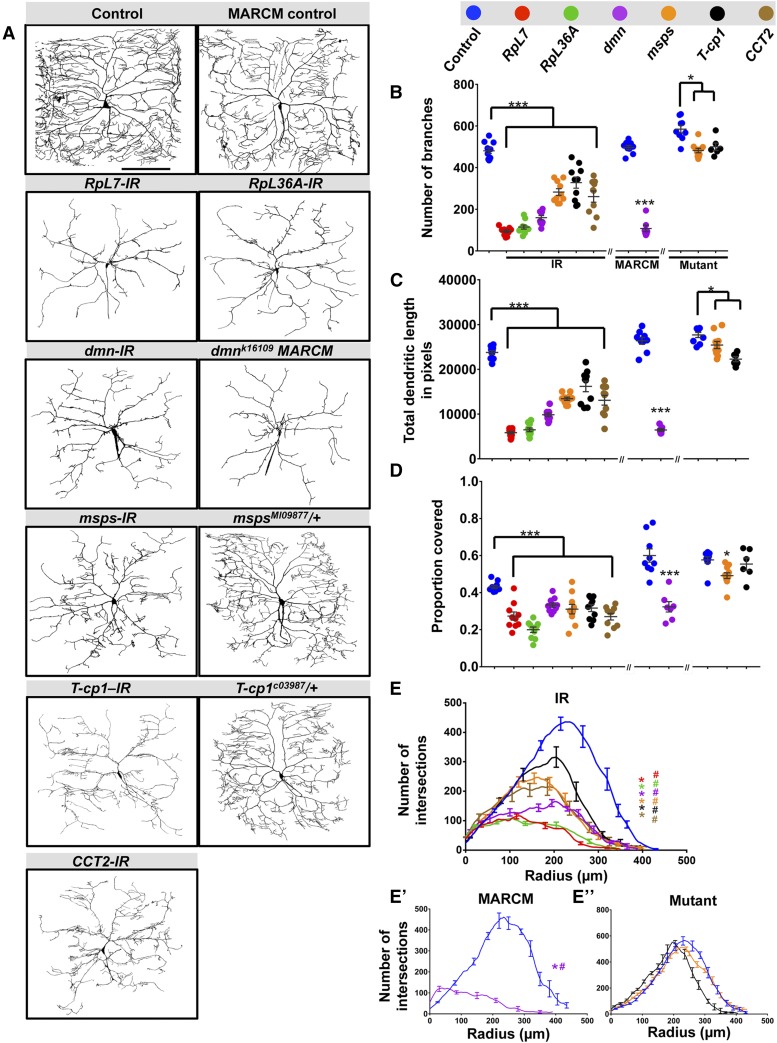
Figure 2.
Phenotypic analyses of Ct and Kn neurogenomic targets: Complexity enhancer category. (A) Representative images of dendritic arborization in controls, gene-specific RNAi knockdowns of CIV (ddaC) neurons (IR), MARCM clones or heterozygous mutant alleles. (B and C) Quantitative analyses measuring number of branches (B) and total dendritic length (C), for RNAi knockdown (IR), MARCM, and mutant analyses. (D) Quantification of the proportion of 10 × 10 pixel squares covered by dendrite for a quadrant of the overall dendritic arbor (upper right quadrant relative to the cell body). (E–E”) Sholl analysis profiles where values are the mean (± SEM) for the number of intersections as a function of radius distance (Euclidean) from the cell body (zero), where * and # refer to the significance scores for the critical value and the corresponding radius, respectively. Statistical tests performed in: (B–E”) one-way ANOVA with FDR correction of Benjamini, Kriega, and Yekutieli. N = 6–10 neurons, and significance scores were: * P < 0.05, *** P < 0.001, # P < 0.05. Bar, 200 µm.

