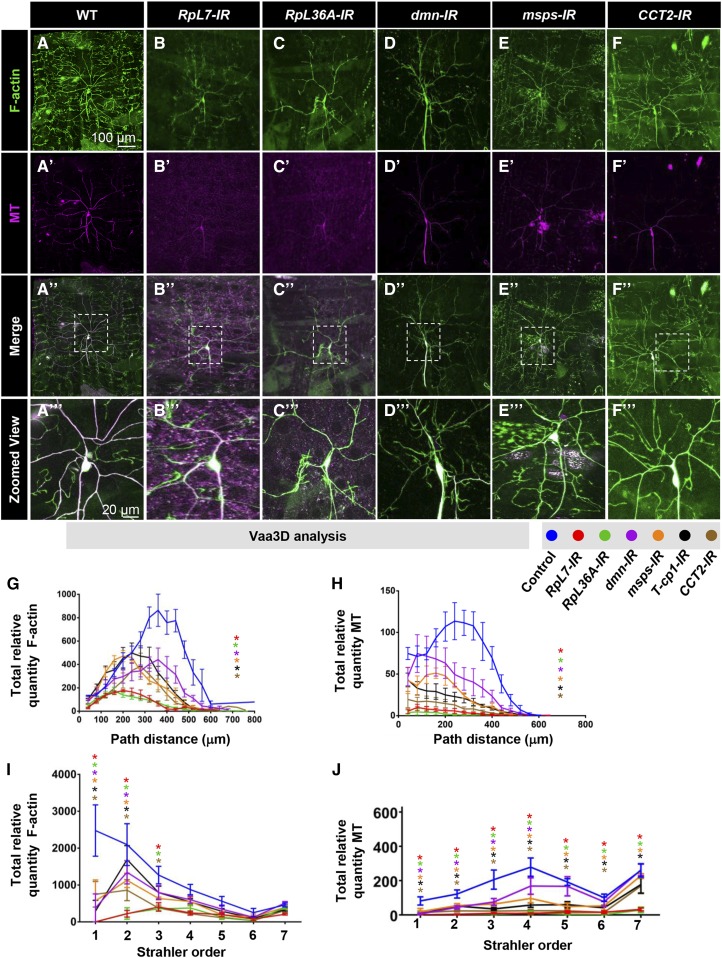
Figure 6.
Cytoskeletal effects of Ct and Kn effector molecules in the complexity enhancer category. Representative images of CIV (ddaC) neurons labeled by class-specific GAL4 expression of UAS-GMA (F-actin) (A–F) and UAS-mCherry::Jupiter (MT) (A’–F’). (A) Wild-type (B–F) gene-specific RNAi (IR) knockdowns. Zoomed views in (A”’–F’”) represent the dashed boxes in the corresponding merge panel (A”–F”). (G–J) Quantitative analyses of multichannel next generation reconstructions of CIV neurons. (G and H) Sholl profiles of total relative F-actin quantity (G) or total relative MT quantity (H) measured as a function of path distance from the soma. Colored asterisks report significant changes in critical value. (I and J) Total relative F-actin quantity (I) or total relative MT quantity (J) by Strahler order distribution, where 7 = primary branch from cell body and 1 = terminal branches and values are the mean (± SEM). Statistical tests performed in: (G and H) one-way ANOVA with FDR correction of Benjamini, Kriega, and Yekutieli; (I and J) two-way ANOVA with FDR correction of Benjamini, Kriega, and Yekutieli. N = 3–6 neurons, and significance scores are * P < 0.05.

