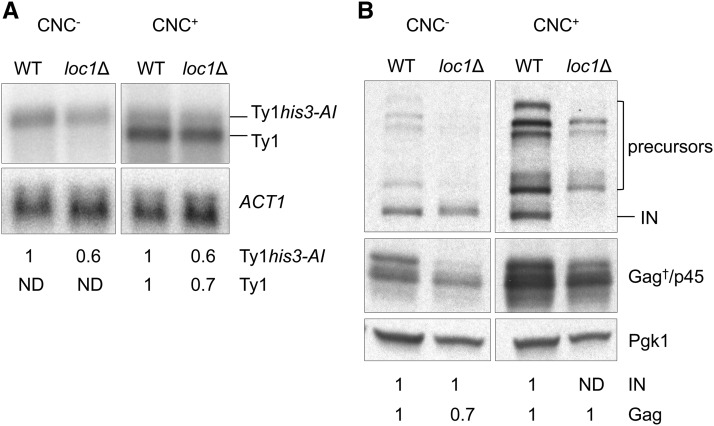
Figure 2.
Ty1 RNA and protein levels in congenic CNC− and CNC+ WT and loc1Δ strains expressing pBDG606. (A) Northern blot analysis of total RNA hybridized with a 32P-labeled riboprobe containing Ty1 nt 238–1702 to detect Ty1his3-AI and chromosomal Ty1 transcripts. ACT1 served as a loading control. Below are relative changes in RNA level compared to WT as determined by phosphorimage analysis. (B) Western blot analysis of Ty1 IN and Gag detected in total cell extracts (40 μg/lane) of CNC− and CNC+ loc1Δ mutant strains. Refer to Figure 1 legend for a description of Ty1 proteins. Pgk1 served as a loading control. Numbers below each panel indicate relative changes in protein level compared to WT as determined by quantification of protein bands by densitometry. ND, not detected.

