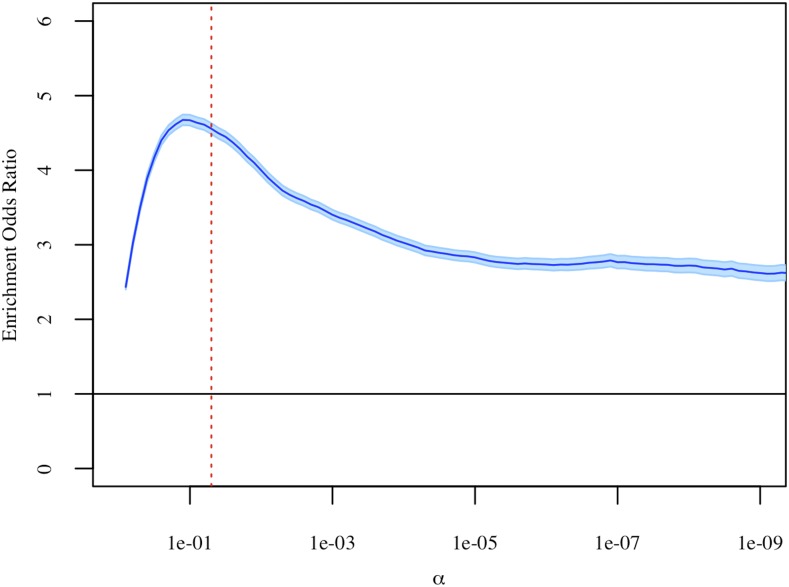
Figure 3.
Results of Fisher’s exact tests at varying significance levels. Sets of age-differentially-methylated CpG sites and heritable CpG sites were defined after multiple test correction. The estimated enrichment odds ratio is shown in dark blue, with the 95% C.I. shown in light blue. The dashed red line represents α = 0.05.

