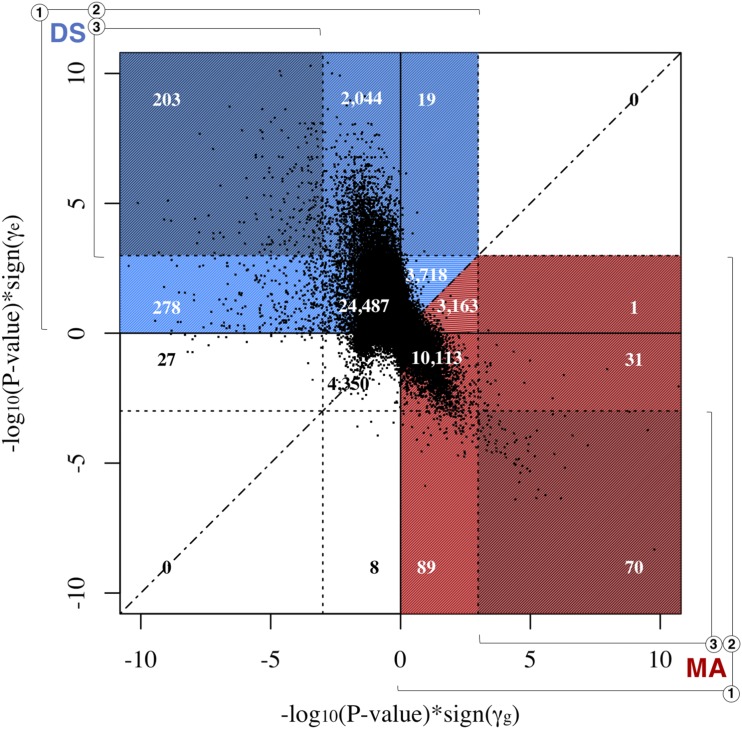
Figure 4.
Scatterplot visualization of categorization of mutation accumulation (MA)- and disposable soma (DS)-consistent sites. The significance and sign of the estimated values of (x-axis) are plotted against the significance and sign of the estimated values of (y-axis). Each point represents one CpG site. The dotted lines represent the genome-wide significance levels for and and divide the graph into 16 sections used to visualize the categorization of sites. Counts are superimposed onto color-coded sections to show theory classification and group inclusion. Red indicates a section with MA-consistent sites. Blue indicates a section with DS-consistent sites. Group membership based on significance is indicated by color shade and numbered brackets. The dashed line represents the = identity line, and serves to separate counts in sections where there are sites that are consistent with both MA and DS.

