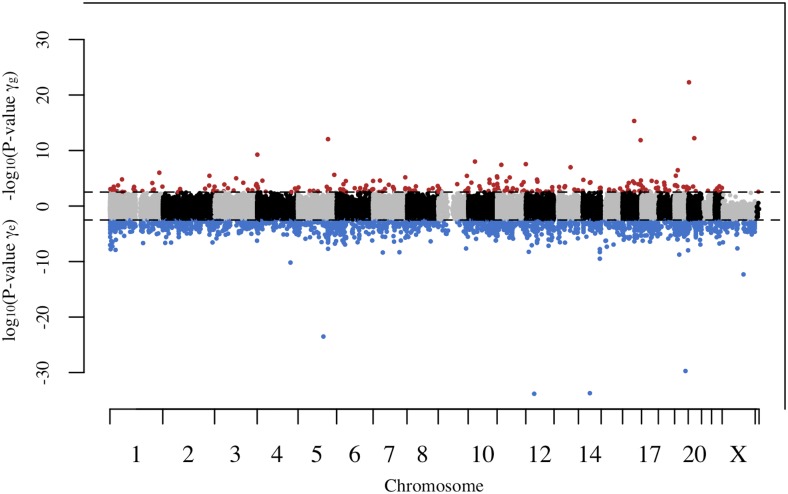
Figure 5.
Manhattan plot of and P-values. Each point represents one CpG site consistent with either MA or DS. The dashed lines represent genome-wide significance (FDR < 0.05). All CpG sites consistent with MA and belonging to significance groups 2 and 3 are in red. All CpG sites consistent with DS and belonging to significance groups 2 and 3 are in blue. DS, disposable soma; FDR, false discovery rate; MA, mutation accumulation.

