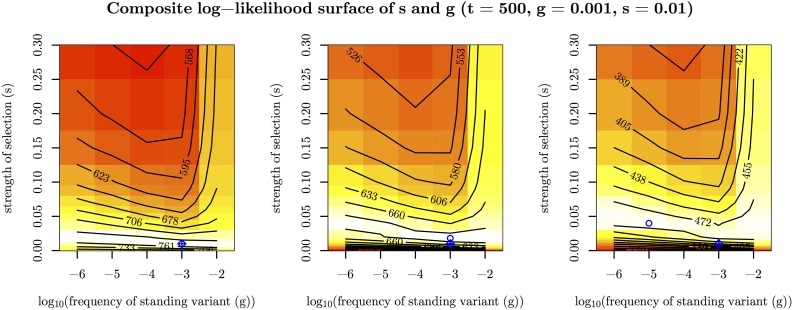
Figure 5.
Composite log-likelihood surface of the strength of selection (s) and the frequency of standing variant (g) for three simulations (with = 10,000, t = 500, g = 0.001, and ) to exemplify confounding of s and g under the standing variant model. Blue diamond pluses represent the true location of the parameters used for simulation. Blue circles represent MCLE.

