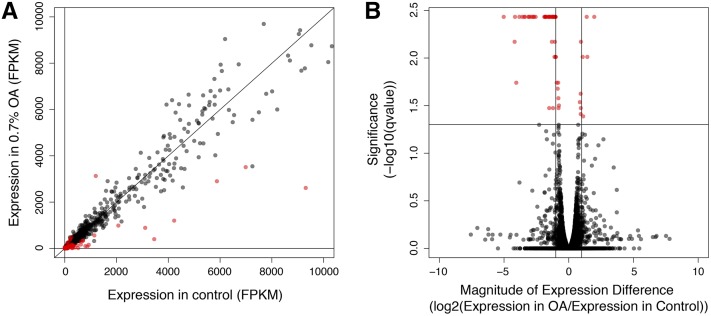
Figure 2.
RNA-sequencing analysis of D. sechellia gene expression response to 0.7% OA. (A) Scatterplot of all differentially expressed genes in D. sechellia adult female flies upon exposure to 0.7% octanoic acid (OA) in Fragments Per Kilobase of transcript per Million mapped reads (FPKM) is shown (red = significant, black = nonsignificant). (B) Volcano plot of differentially expressed genes plotting the magnitude of expression difference against significance from the statistical test performed. The horizontal line represents q-value = 0.05.

