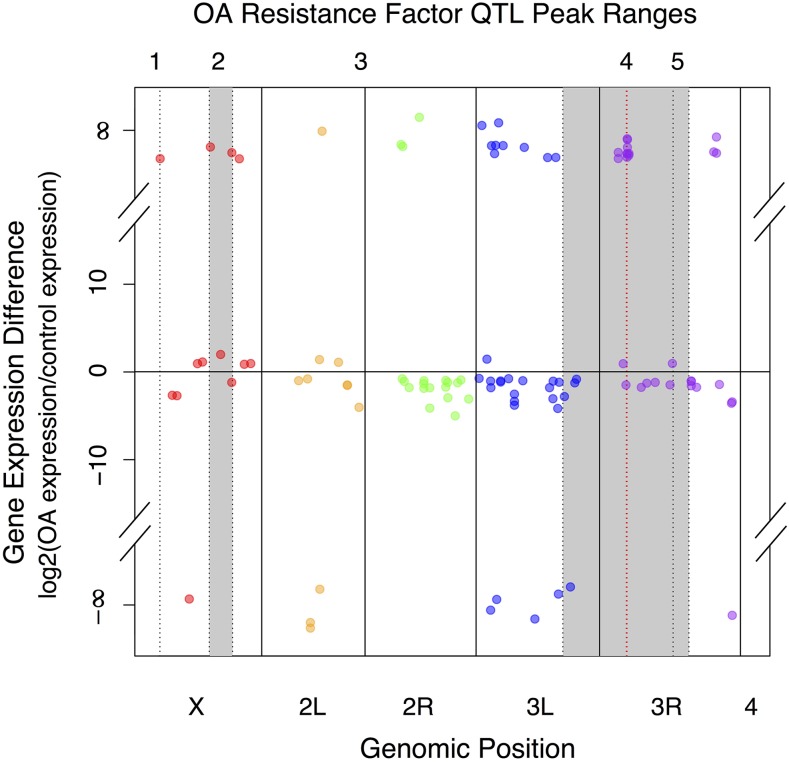
Figure 3.
Significantly differentially expressed genes overlaid onto Quantitative Trait Locus (QTL) peak ranges for octanoic acid (OA) resistance in D. sechellia adults. Significantly differentially expressed genes are plotted according to chromosomal position (red = genes on the X chromosome, orange = 2L, green = 2R, blue = 3L, and purple = 3R). No significantly differentially expressed genes were found on the fourth chromosome. Shaded gray areas represent QTL peak ranges for adult D. sechellia OA resistance described by Jones (1998, 2005). Red dotted line represents the fine-mapped QTL region from Hungate et al. (2013).

